/r/badeconomics


A friend of mine once said: You know what the problem is with being an economist? Everyone has an opinion about the economy. Nobody goes up to a geologist and says, 'Igneous rocks are fucking bullshit.'
This subreddit is the repository for all of the woeful, antiquated, or plain old misguided notions Redditors post about how the economy works.
Rule I
Please post an explanation (or "RI") on why what you have posted is bad economics, doesn't have to be thesis, but sufficient length to provide context. Link posts are not allowed, so just include a link to the bad economics (or simply a quote) in your RI. Examples of good RI's are here and here but RI's can be shorter. Note that these RI's come from a time when link posts were allowed: RI's are now expected to be in the post itself, not comments.
OP must write an RI in the post itself (not as a comment). Other redditors are encouraged to provide RIs and more information. If an RI is not written, the post will be removed.
Standards for sufficiency here
Rule II
- Please post the link in np. mode. A link should look something like this:
http://np.reddit.com/r/shittyeconomicssubreddit/comments/IIhkVIyIX/Bernakebadtouchedmybitcoin/cktuXLVIIIh
Rule IV
All questions must be asked in the stickied threads or /r/askeconomics. Do not post any "Is [X, Y, Z] bad economics?" self-posts.
Rule V
No reasoning from a price change in general equilibrium.
Rule VI
/u/Ponderay's rule: If you state that a Nobel Prize winning economist is bad economics (e.g. if you disagree with Paul Krugman) you must provide an explanation at least two paragraphs long as to why they are wrong, and you best cite reputable studies or solid data. =)
Rule VII
/u/gorbachev's rule: Discussion of anyone who has been dead for more than 30 years is not allowed unless you present an economic model that contains the aspects of their thought you are interested in discussing. (Empirical tests are okay too.)
Reddit Economics Network
| Subreddit | Subject |
|---|---|
| /r/Economics | General economics discussion and news |
| /r/AskEconomics | Got a question about economics? We'll try to answer it! |
| /r/BadEconomics | Share examples of bad, ill-informed, or just silly economics |
R.E.N. FAQ
- Immigration
- Trade
- Protectionism and Developing Countries
- Inequality
- Basic Income
- Gender Wage Gap
- Minimum Wage
- Economic Methodology
- Automation
- 2007-08 Financial Crisis: Causes
- BLS Jobs Report
- Carbon Pricing
Looking to contribute? Here are instructions and a list of topics needing coverage. Message us!.
Want to Chat?
Finally, want to chat in real time? Check out:
Humor:
LaTeX Plugin
/r/badeconomics
771,320 Subscribers
[The FIAT Thread] The Joint Committee on FIAT Discussion Session. - 24 January 2025
Here ye, here ye, the Joint Committee on Finance, Infrastructure, Academia, and Technology is now in session. In this session of the FIAT committee, all are welcome to come and discuss economics and related topics. No RIs are needed to post: the fiat thread is for both senators and regular ol’ house reps. The subreddit parliamentarians, however, will still be moderating the discussion to ensure nobody gets too out of order and retain the right to occasionally mark certain comment chains as being for senators only.
10:00 UTC
Policy Proposal: Mr Poilievre, it's time to buy out and scale down the Canadian fishing industry.
I kind of want to revive an old badeconomics tradition, with policy proposals being allowed during elections season. Well, we have an election coming up in Canada, and uhh, it's not exactly a mystery who's going to win. I want to talk about an odd policy that I want the government to review and I have included some of what I believe should be done.
Now do you work in the commercial fishing industry? Do you work for Fisheries and Oceans Canada? I want to hear your insider thoughts!
How does commercial fishing work in Canada?
Commercial fishing in Canada is regulated by Fisheries and Oceans Canada. They set the rules, they issue licenses, and they manage the health of our fisheries and the commercial fishing industry.
In the 2023 report covering 2022, Fisheries and Oceans Canada reported that the total size of the Canadian commercial fishing industry harvested 686 metric tonnes of seafood, worth around $4.8 billion Canadian dollars. The industry employs around 45 thousand people, working on nearly 17 thousand commercial fishing vessels.
On paper, Fisheries and Oceans Canada has signed a pledge to discontinue harmful subsidies that damage fish stocks. In reality, things are a little bit different.
The way commercial fishing works in Canada is that the fishing season has a max length, and no fishing is permitted outside of the season. However, Fisheries and Oceans Canada also calculates a total allowable catch, for each species and each waterbody. Once the total allowable catch is reached, the season is effectively over, as commercial fishermen can no longer catch any more.
What this means is that depending on the species you target and the region where you operate, many commercial fishermen only work for very short periods of time.
Now what do commercial fishermen do when the season is closed? They go on Employment Insurance (EI). According to the latest EI rules, you will qualify for EI when the season is closed if you have reached a threshold of total fish value caught. This threshold is pretty low, between $2500 - 4200. The government also sets a total earning threshold, where if your total income (from all sources including EI) exceeds a certain threshold, they will claw back your EI. Right now this threshold is around $70k/year
What is the problem?
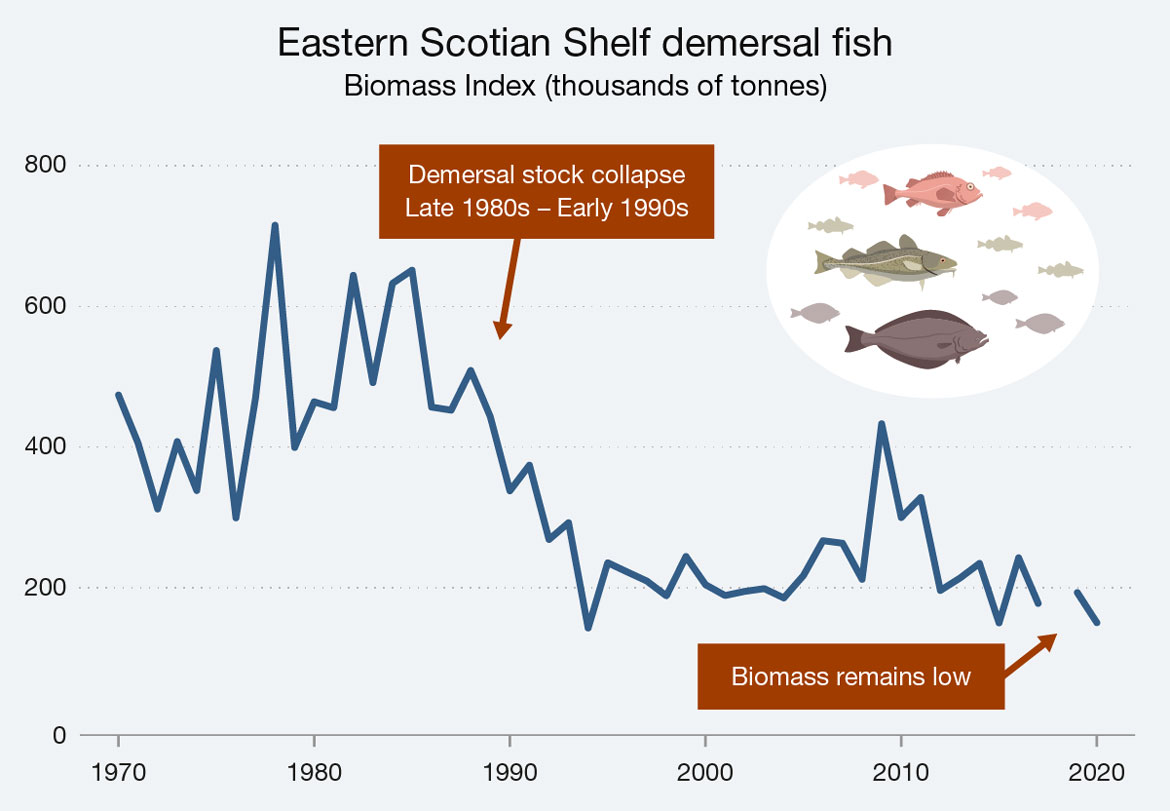
Canada's fisheries aren't exactly very healthy. The most famous example is the Newfoundland Cod fishery - the population crashed in the 1990s, and the government banned commercial offshore cod fishing. This caused massive widespread economic devastation and actually dropped the population of the province by 10%.
Well, the government controversially reopened the offshore cod fishery last year. Allegedly, Fisheries and Oceans Canada set a limit higher than what their internal models recommended - 18000 tonnes with offshore fishing allowed, instead of 13000 tonnes and inshore only. Supposedly, this was due to pressure by Liberal politicians - Newfoundland and Labrador is a Liberal stronghold.
And then what happened? Even at the higher 18000 tonne limit, Fishers and Oceans Canada ended up shutting down the whole thing a month later, as the quota was quickly reached. What this means is that if you're a fulltime cod fisherman (TBF, there aren't many of them left), you were only permitted to work 1 month a year, and you will be taking EI for the rest of the year.
If you look at Fisheries and Oceans Canada's ecosystem assessment reports, and line them up with catch reports and quotas, you will quickly notice a serious problem. For instance, Herring has a low biomass in the Gulf of St Lawrence, and a historically low presence in the Scotian Shelf. Yet the same year, commercial fishermen harvested 77 thousand tonnes of Herring.
Just look at this chart and see that although some species are doing ok, broadly speaking, most species aren't doing very well. Looking at Groundfish and Pelagic fish, the industry has already imploded and total fish caught is a fraction of what it used to be 35 years ago.
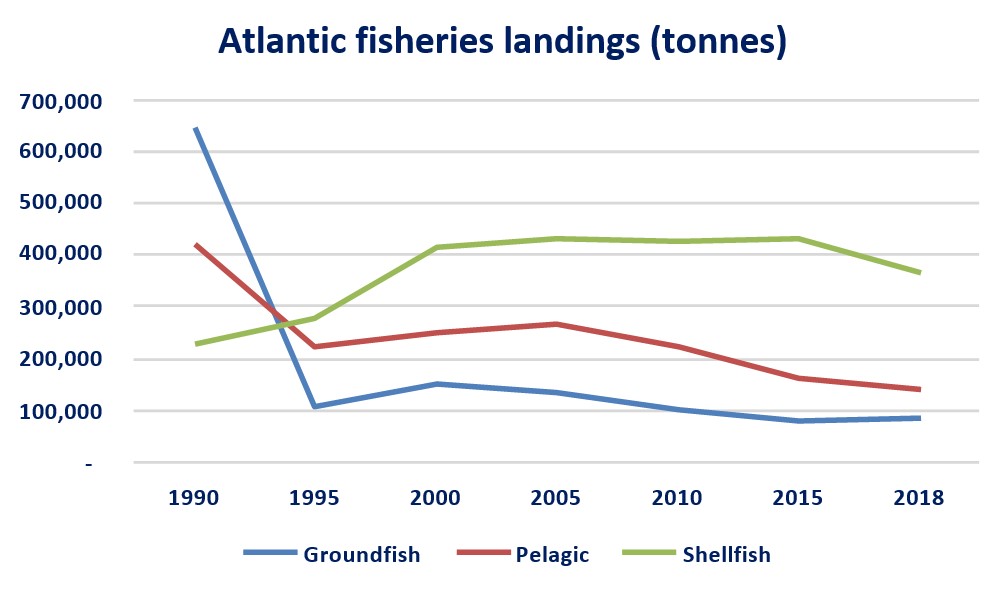
Remember, if a species isn't doing well, the total allowable catch will be small, and thus, the season is shorter, and the fishermen are going on EI for longer!
Based on current EI data, the average fishermen clamed ~$13 thousand between April 2024 and January 2025. So if you extrapolate, the average fishermen gets what, ~$17.5k/year in EI? At an average of $500/week, the average fishermen received 35 weeks of EI a year (I know this calculation is very, very crude)
So in conclusion:
- Canada's fish stocks are not very healthy, and thus, total catch limits are set low
- Low catch limits mean short seasons
- Short seasons and low catch limits mean Fishing is not a very profitable business right now
- Many fishermen are taking EI more weeks than they fish.
The policy proposal:
Step one: have Fisheries and Oceans Canada should do a full assessment on all of Canada's commercial fisheries and realistically assess catch limits. Catch limits for any struggling species should be rapidly cut down.
Step two: determine which species will hit their total catch limits before the natural end of the season.
Step three: restrict issuance of new licenses for these fisheries and offer a buyout for existing fishermen. Target younger fishermen who have just joined the industry.
I think this is the most controversial part, but like, let's be honest and realistic here. If you're a 25 year old just getting started in the business, and you expect to work for 40 more years, the amount of lifetime EI you're expected to get paid out is quite high. $700k by my back of napkin math. (I know you're also paying in from your fishing earnings, but not nearly that much).
Like seriously, the government can literally give you a big lump sum (like $100k) to buy back your license, buy your boat, pay your tuition at a local university, and still come out ahead financially.
By reducing the number of fishermen, the remaining fishermen can go catch more, extending the fishing season (and thus, reducing EI payout durations), improve earnings for remaining fishermen, and it will not increase total food costs or impact employment in seafood processing (since the total amount of fish harvested won't change).
Fisheries and Oceans Canada can probably also do a licensing swap scheme - If for instance, a fishermen holds two licenses, one to an unsustainable fishery like Cod, while simultaneously holding one to a sustainable fishery like lobster, when the government buys them out, the lobster license could possibly be offered to another fishermen in a swap for their license to an unsustainable fishery.
Now I fully understand and respect that this is a profession, and a lifestyle. But perhaps it is time for us to honestly admit that this is probably not the industry of the future, and that by shrinking the size of the industry, we it will produce better outcomes for the taxpayer and remaining fishermen.
23:11 UTC
I'm here to preach to the choir: Mass deportation is bad economics
Our great leader plans to begin his wondrous mass deportation plan tomorrow. Most of the people reading this are already all-too familiar with discussions around immigration and its effects on native wages and employment. Rather than re-doing all of that, I’m going to summarize it in a few paragraphs and then narrowly focus on mass deportation. Previous posts on the subject in this subreddit can be found by using the internet. I'm going to be treating undocumented immigrants and legal immigrants as being essentially the same for the purpose of asking "Do immigrants reduce native-born wages?" and "Do deportations help the native-born?". The question of whether they're different has been covered here before. The TL;DR is no, and what I say next is essentially a regurgitation of this page, though I wrote this before reading it.
A very simple theoretical approach to immigration tells you that if you increase labor supply, wages go down. Easy! Immigrants are a substitute for current workers, it’s Just Supply and Demand.™ But a better approach to the same question tells you that if you increase labor supply in the entire economy, labor demand increases as well (what are the new workers going to do with their new income?), and the effect on wages is ambiguous.
What's more, most immigrants are actually complements to native-born workers, doing more labor-intensive work while Americans do more language-intensive white-collar work, which isn't so easy if you primarily speak Spanish. The biggest losers are previous immigrants, who often lack language skills and are substitutable with new immigrants. As new immigrants come in, wages tend to fall for these workers, not native-born Americans.
As for what happens in practice, the earliest insight came from David Card’s famed paper on the Mariel boatlift out of Cuba and into Miami, Florida. A lot of people immigrated, and it made no significant difference in the wages and employment of people already living in Miami, save for some subgroups. Then George Borjas looked at the same data and found a 10-30% negative impact on the wages of high school dropouts. Card's paper also wasn't perfect and suffered from measurement error, but Borjas was working with a small sample size, so his paper wasn't very good either. Giovanni Peri’s paper, released after Borjas', was a response to his and found no negative effect on the wages of high school dropouts living in Miami before the boatlift. Other papers looking at different increases in immigration have found similar results, e.g. a 12% increase in the population of Israel due to immigration having no apparent effect on wages.
But not everything is sunshine and roses. There were some negative effects on American mathematicians when ex-Soviet mathematicians immigrated to the United States after the collapse of the Soviet Union in 1991. This is interesting for a variety of reasons, but primarily because it seems to confirm what one might expect in theory: if the immigrants you’re looking at tend to have a specific skill set, supply effects in their industry will outweigh demand effects, and natives with that same skill set will be worse off (while everyone else gains). Why? Well, because mathematicians don’t spend all of their money on buying mathematics papers from others. If instead a group of immigrants that matches the skill distribution of the current population showed up, their effects on supply and demand in different industries would be more even.
So what about mass deportation? In theory, it's a bad idea, and in practice, it’s a bad idea. Once you’ve removed ten million people from the country, demand will almost certainly take a hit, the same as supply. The entire economy would be forced to scale down: supply decreases, demand decreases, the effect on wages is ambiguous and the effect on total output is unambiguously negative. One estimate puts the effect on GDP at -4.2% to -6.8%. Unsurprisingly, getting rid of one of the factors of production is expected to make your economy shrink.
We do have real-world estimates of the effect of deportations on employment. The Secure Communities Program increased deportations throughout the United States and, to the great pleasure of labor economists, was deployed at different times in different counties because some were better prepared for it. That makes it as good as random, and hopefully uncorrelated with other things that could affect employment outcomes. (If it were correlated with something else that affects employment outcomes, any simple estimate of its effects that doesn't control for that would suffer from omitted variable bias.) As it turns out, counties that ramped up deportations earlier than others had slightly worse employment outcomes for native-born Americans. (While we’re on the subject, they also didn’t have lower crime rates.)
If you managed to deport every undocumented immigrant, it would mean getting rid of 4.8% of the workforce. The burden would fall especially heavy on some industries compared to others, like construction, where undocumented immigrants make up about 14% of the workforce. This looks like the reverse of the mathematician scenario. Shouldn’t construction workers expect to gain from mass deportation? Maybe! We don’t have any papers answering such a narrow question. In any case, the same supply-and-demand logic that tells you construction workers would gain also tells you that industries with fewer undocumented immigrants than the country as a whole would have lower wages after mass deportation, since labor supply changes would be minimal and demand would fall. We would be arbitrarily redistributing between people in different jobs.
Anyway, while I’d bet these construction workers would gain if you snapped your fingers and made 12% of their comrades disappear, that’s not how mass deportation works. You have to spend money to make it happen, which inevitably comes from tax revenues in some way. And if you can somehow strangle Congress into giving you that money, which would be something like $315 billion, you’re going to be using it to set up detention centers for keeping people while you put them through the long and complicated legal process of deporting them. You’ll also need to hire plenty of law enforcement officers to find and detain every undocumented immigrant.
This makes mass deportation sound impractical, but I do think mass deportation is easier in practice. If you want to get rid of undocumented immigrants, it's sufficient to scare them enough for them to choose to return to their countries of origin. Operation Wetback was able to do this, scaring about as many people into leaving in its first month of implementation (60,000) as the government actually apprehended throughout the country per month.
In any case, the essential points are still there. If the government were about to spend $315 billion on forcefully removing ten million people from the country, one would hope there’s a lot of good evidence that this will be useful. Instead, we have an immigration literature that points to wage and employment effects being near zero, and evidence from actual deportations that shows they don’t help employment or crime either. You also need to spend a lot of money to get the job done. Maybe you think we should do mass deportation because it's important to enforce the law, but frankly I don't think anyone really believes that, since that would imply you also want more people to be fined for jaywalking, arrested for sitting on the sidewalk in Reno, or having more than one illegitimate child in Mississippi.
On the bright side, it seems doubtful that any of this will actually happen. I only expect Trump to find some way to reallocate some spending toward deportations, increase their rate, scare some people into leaving, and finish his term in 2029 with millions of undocumented immigrants still living in the country.
Call me crazy, but I’m starting to think politicians don’t listen to economists.
Edit: Time for a shameless plug. If you enjoyed my writing, you might want to check out my blog.
17:18 UTC
Arbitrage as Gauge theory
Physics has contributed much to economics--Brownian motion, Girsanov transformations, and mean-field games all originate from physics.
In a previous post (imo the best R1 of all time), a PhD mathematician analyzes Eric Weinstein's "economics as gauge theory", concluding it is neither economically nor mathematically sound. This post is a continuation; I (also a mathematician, but not the same guy) will do a similar thing for the recent attempt of the following paper (henceforth, "the paper") to frame arbitrage via gauge theory.
Preliminaries
You will need to know about changes of numeraire and arbitrage. Read about it below if this is unfamiliar to you.
Change of numeraire is a concept from finance. Given some quantity X, denominated in units (e.g. in US dollars), a change of numeraire is a way of converting X to another unit system (e.g. to Canadian dollars).
Arbitrage is another concept from finance. A market admits arbitrage if it is possible to earn profit (above the risk-free interest rate--think of this rate as the amount your bank account pays you in interest) without taking on any risk. No arbitrage is an embodiment of the saying "There ain't no such thing as a free lunch": every potential profit opportunity above the interest rate you get at the bank requires you to take on the risk of losing your initial bet. (Personally, I find this analogy rather deficient; it originates from Kreps (1981), the first real paper on arbitrage.)
Change of numeraire as a gauge transformation
Let X denote the stock prices, denominated in normal currency units (e.g. in USD). The paper views changes of numeraire via the following gauge-type transformation:
(*) X --> D times X (Note: I use D here, they use capital lambda in the paper)
Here, D represents how much $1 is worth relative to the new unit (e.g., if we are converting to CAD, D at the current time is 1.44, the exchange rate between USD and CAD). It is quite strange to call (*) the numeraire-transformed version. D isn't the numeraire; 1/D is. D, to be consistent with the finance literature, should be called the "deflator".
The introduction states:
In physics, curvature is a gauge invariant measure of the path dependency of some physical process... In analogy with [this physical principle], we expect that any measure of arbitrage should be invariant under the gauge transformation in (*).
This observation is the crux of the paper. But it is also wrong-headed.
There are two ways to view the effect of numeraire changes:
- Applying to X directly: stocks are traded and sold in the new units. This corresponds to a "new stock price" Y which equals D times X (see, e.g., Delbaen and Schachermayer (1995))
- Applying to trading strategies: X is traded in the original units, but the result of adopting a trading strategy are measured relative to the new units (see, e.g., Kabanov, Kardaras, and Song (2016)).
For (1), the invariance of arbitrage under changes of numeraire fails. For example, suppose X is always positive--which is the case for geometric Brownian motion, the usual model used for stock prices (e.g., in the Black-Scholes option pricing model). Then X transformed by D(t) = X**^(-1)****(t)** times exp(r times t) for large enough r, where t is the current time, fails no arbitrage. Less artificial counterexamples can be found in Delbaen and Schachermayer (1995), which was reprinted in Chapter 11 of "The Mathematics of Arbitrage"--a book cited by the paper. (Chapter 11 is even called "The No-Arbitrage Property under a Change of Numeraire"--perhaps they should have read the table of contents.)
For (2), the invariance of arbitrage under changes of numeraire also fails. This is related to and caused by the in-equivalence of two notions of arbitrage: no free lunch with vanishing risk, and no unbounded profit with bounded risk. This inequivalence can be demonstrated via Bessel processes (see, e.g., Delbaen and Schachermayer (1995b)).
Arbitrage curvature and a related estimator
No arbitrage is proved (though I can't vouch for their correctness) to be implied by the positivity of a curvature. An estimator is made for this quantity (no consistency results though). Then, this estimate is applied to the stock market, in an attempt to understand whether no-arbitrage holds (they assume a geometric Brownian motion). I think any attempt to determine whether arbitrage holds or not is ill-posed. I explain below.
It is well-known that no arbitrage is equivalent, in the GBM setting, to something like invertibility of the volatility matrix (see page 12 of Karatzas and Shreve (1998)). More precisely, if mu denotes the vector of mean returns, no arbitrage is equivalent to the existence of some vector theta such that:
(**) mu = sigma times theta
where sigma is the volatility matrix. If you make an estimator sigma^hat (which, let us suppose, is consistent) for the volatility matrix, you therefore are seeing whether (**) is well-posed if we replace sigma with sigma^hat. Unfortunately, this doesn't work if you want to show that financial markets admit arbitrage (which is the conclusion the paper makes): even if each of the sequence of estimators fails (**), the limit of them (which is almost-surely well-defined and equal to sigma, by consistency) may actually not fail (**), since for fixed mu the set of matrices sigma failing (**) is not closed.
Toy example: Let e1=(1,0) and e2=(0,1). Suppose mu=e1, sigma=e1 tensor e1, your estimator **sigma^hat=**the sequence sigma(1),sigma(2),sigma(3) etc where **sigma(i)=**e1 tensor (e1 + (1/i)e2). Then:
image of sigma(i) = span of (e1+(1/i)e2) which does not contain mu for each i, even though the image of sigma does.
Note: the above analysis does not use the curvature method presented in the paper. But it still shows some issues with the analysis--namely, that you cannot conclude that there is arbitrage just because your estimators show there is arbitrage.
Final remarks
I am someone well-versed in probability theory and stochastic processes. This paper was very difficult to follow and read, and the notation is very nonstandard. Some parts of the paper, I think, genuinely do not have any mathematical meaning (like the discussion of the "tangent space" dX_mu--how do you do differential geometry for curves which are nowhere differentiable?). Furthermore, I do not see how any of the quite advanced mathematics used brings any new economic meaning.
03:03 UTC
[The FIAT Thread] The Joint Committee on FIAT Discussion Session. - 12 January 2025
Here ye, here ye, the Joint Committee on Finance, Infrastructure, Academia, and Technology is now in session. In this session of the FIAT committee, all are welcome to come and discuss economics and related topics. No RIs are needed to post: the fiat thread is for both senators and regular ol’ house reps. The subreddit parliamentarians, however, will still be moderating the discussion to ensure nobody gets too out of order and retain the right to occasionally mark certain comment chains as being for senators only.
21:00 UTC
[The FIAT Thread] The Joint Committee on FIAT Discussion Session. - 01 January 2025
Here ye, here ye, the Joint Committee on Finance, Infrastructure, Academia, and Technology is now in session. In this session of the FIAT committee, all are welcome to come and discuss economics and related topics. No RIs are needed to post: the fiat thread is for both senators and regular ol’ house reps. The subreddit parliamentarians, however, will still be moderating the discussion to ensure nobody gets too out of order and retain the right to occasionally mark certain comment chains as being for senators only.
08:00 UTC
[The FIAT Thread] The Joint Committee on FIAT Discussion Session. - 20 December 2024
Here ye, here ye, the Joint Committee on Finance, Infrastructure, Academia, and Technology is now in session. In this session of the FIAT committee, all are welcome to come and discuss economics and related topics. No RIs are needed to post: the fiat thread is for both senators and regular ol’ house reps. The subreddit parliamentarians, however, will still be moderating the discussion to ensure nobody gets too out of order and retain the right to occasionally mark certain comment chains as being for senators only.
19:00 UTC
[The FIAT Thread] The Joint Committee on FIAT Discussion Session. - 09 December 2024
Here ye, here ye, the Joint Committee on Finance, Infrastructure, Academia, and Technology is now in session. In this session of the FIAT committee, all are welcome to come and discuss economics and related topics. No RIs are needed to post: the fiat thread is for both senators and regular ol’ house reps. The subreddit parliamentarians, however, will still be moderating the discussion to ensure nobody gets too out of order and retain the right to occasionally mark certain comment chains as being for senators only.
06:00 UTC
[The FIAT Thread] The Joint Committee on FIAT Discussion Session. - 27 November 2024
Here ye, here ye, the Joint Committee on Finance, Infrastructure, Academia, and Technology is now in session. In this session of the FIAT committee, all are welcome to come and discuss economics and related topics. No RIs are needed to post: the fiat thread is for both senators and regular ol’ house reps. The subreddit parliamentarians, however, will still be moderating the discussion to ensure nobody gets too out of order and retain the right to occasionally mark certain comment chains as being for senators only.
17:00 UTC
[The FIAT Thread] The Joint Committee on FIAT Discussion Session. - 16 November 2024
Here ye, here ye, the Joint Committee on Finance, Infrastructure, Academia, and Technology is now in session. In this session of the FIAT committee, all are welcome to come and discuss economics and related topics. No RIs are needed to post: the fiat thread is for both senators and regular ol’ house reps. The subreddit parliamentarians, however, will still be moderating the discussion to ensure nobody gets too out of order and retain the right to occasionally mark certain comment chains as being for senators only.
04:00 UTC
Does the Texas Real Estate Research Center not understand inflation, distribution functions, or the housing market?
Longtime member, irregular poster, alt cause my main is pretty doxxy and I don’t want to be known for trashing potential employers.
As a future real estate economist (fingers crossed) I've been poking around on JOE and noticed the postings for the Texas Real Estate Research Center. While looking through their website I found this gem.
The median price for new and existing homes combined has increased 41 percent in the last five years. This far exceeds the 28 percent increase in single-family rent and the 17 percent increase in apartment rent.
How is anyone who has been paying attention still talking about housing purchase affordability in terms of price? These last few years have been remarkable in illustrating the role of interest rates to purchase affordability and it has been amazing how fast the comprehensive switch by everyone else to talking about monthly payment affordability has been in the real estate affordability world.
This overall price change masks an underlying dynamic. While home prices are up generally, there has been a dramatic shift across price cohorts. This shift accounts for much of the affordability challenge.
How can anybody reasonably mathematically literate write these two sentences back to back without pause? Arbitrary cutoffs on top of a price distribution causes shifts in segments as the general distribution shifts. As seen here, in this random chart from a random mathematical article, where the average/median, of whatever they are measuring, shifts from 100 to 150.
The new-home segment often sets the pace for home prices at the margin since builders price them to reflect the latest supply and demand conditions.
What? This is one of statements that is broadly true but particularly meaningless. While the whole of Supply and Demand set the price and increases in price should be somewhat limited in the mid to long term by the marginal cost of providing new housing. This is also true of rental homes and apartments though so why are we talking as if it is particularly meaningful to purchased houses? This doesn't explain the 41 vs 28 vs 17% changes in the three markets.
Recently, new homes’ impact may be even higher as they represent an increasing share of sales.
So, is the all market median price rising just because older houses aren't selling? This is an actual distributional change. But, we also just claimed that the reason we are interested in new homes is because they are the marginal production that sets the price, so why does it matter how big or small the margin is here?
If we segment new home starts into three categories based on sale price—less than $300K, between $300K and $500K, and $500K and up—we get the situation in Figure 1. For years, homes in the lowest price cohort were the norm, but no longer. Between 2001 and 2014, homes in that lowest category accounted for between 60 and 89 percent of all starts in Texas. That share had fallen 53 percent by the middle of 2020. In less than two years, the share of this core housing category had fallen further to just 13 percent of all starts. It has recovered only slightly to 20 percent this summer.
Let's use the same chart as before but pretend the price cutoff was 125k The previous median/average price would then be 100k and all prices increase by 50% (or 50k) to an average/median of 150k, by defintion of every thing that a somewhat normal distribution function can be the percentile above and below our cutoff which is above and below the original and final mean, respetively, changes drastically.
As it happens, the Center itself has this data. In the middle of 2020 the median price was $269,000 and by August of 2024 the median price had risen to $340,000. This $300k cutoff is almost chosen to precisely make this average increase in pricing have the greatest impact on the segmentation.
This shift reflects a combination of factors, including that construction costs are up 43 percent in the last five years. Some of the shift also reflects builders adding larger models to their projects to meet the pandemic-era need for more living and working space at home.
1.43 x $269,000 = $384670, more than explains the actual increase in median price, if this framework were correct anyways. Especially if there was actually a shift to larger homes, which is the opposite of what the data shows. Instead home builders have been shrinking their homes, and as it happens [lot sizes](https://www.nahb.org/blog/2024/07/share-smaller-lots-reaches-new-high#:~:text=Close%20to%20two%20thirds%20(65,one%2Dfifth%20of%20an%20acre.), likely precisely in response to these affordability challenges cause by the increase in interest rates.
This shift in new home price cohorts has impacted the overall housing market in Texas. Figure 2 documents how median home prices have moved among the same three price cohorts
I think this is the best sentence pair to illustrate the utter confusion of how distributions work.
Texas’ affordability challenge is driven by both supply and demand factors. The shift in market share across home price segments reflects the combined behavior of builders, homeowners, and potential buyers.
This is so anodyne. An inane end to an article that didn't actually address any of the supply or demand factors that are challenging the housing market. This blog post could have just been one circular sentence. Prices are going up (more homes are in higher price distributions) because prices are going up (because homes have have increased in price).
Together, they have moved the market heavily toward the higher-price end.
And this was absolutely not illustrated. Likely because it is the opposite of the truth with builders responding to higher costs and affordability concerns by shifting downward in both house size and [lot size](https://www.nahb.org/blog/2024/07/share-smaller-lots-reaches-new-high#:~:text=Close%20to%20two%20thirds%20(65,one%2Dfifth%20of%20an%20acre )
15:12 UTC
[The FIAT Thread] The Joint Committee on FIAT Discussion Session. - 04 November 2024
Here ye, here ye, the Joint Committee on Finance, Infrastructure, Academia, and Technology is now in session. In this session of the FIAT committee, all are welcome to come and discuss economics and related topics. No RIs are needed to post: the fiat thread is for both senators and regular ol’ house reps. The subreddit parliamentarians, however, will still be moderating the discussion to ensure nobody gets too out of order and retain the right to occasionally mark certain comment chains as being for senators only.
15:00 UTC
[The FIAT Thread] The Joint Committee on FIAT Discussion Session. - 24 October 2024
Here ye, here ye, the Joint Committee on Finance, Infrastructure, Academia, and Technology is now in session. In this session of the FIAT committee, all are welcome to come and discuss economics and related topics. No RIs are needed to post: the fiat thread is for both senators and regular ol’ house reps. The subreddit parliamentarians, however, will still be moderating the discussion to ensure nobody gets too out of order and retain the right to occasionally mark certain comment chains as being for senators only.
01:00 UTC
2024 Nobel Prize in Economics awarded to Daron Acemoglu, Simon Johnson and James A. Robinson
11:04 UTC
[The FIAT Thread] The Joint Committee on FIAT Discussion Session. - 12 October 2024
Here ye, here ye, the Joint Committee on Finance, Infrastructure, Academia, and Technology is now in session. In this session of the FIAT committee, all are welcome to come and discuss economics and related topics. No RIs are needed to post: the fiat thread is for both senators and regular ol’ house reps. The subreddit parliamentarians, however, will still be moderating the discussion to ensure nobody gets too out of order and retain the right to occasionally mark certain comment chains as being for senators only.
12:00 UTC
Letter to VP Harris: Food prices are not the problem but overconsumption is
Repost from yesterday but adding R1, apologies!
R1: Harris spends a lot of time talking about lowering food prices. This is bad economics because (a) it avoids the root of the problem, which is overconsumption, (b) lower food prices can impact farmers who already operate with tight margins, (c) ignores the fact that with the introduction of Ozempic and related drugs consumption will start trending down anyway leading to a squeeze on the industry (lower prices + less consumption), and (d) the economic damage, not to mention societal, of obesity is largely overlooked by both parties opting instead of short term fixes instead of long term planning.
Hope that does it, and thanks!
"Dear Vice President Harris:
Hungry Americans expect you to lower food prices the minute you are in the White House. However, this directive may not be necessary as the hunger issue will soon resolve itself. Thanks to Ozempic, Mounjaro, and Wegovy, food consumption will plummet so significantly that supply will far outstrip demand. Instead of grappling with inflationary prices, we will confront deflationary food prices!
Walmart US operations CEO John Furner revealed to shareholders a noticeable shrinkage in the overall shopping basket size among consumers taking these miracle medications. Facebook Ozempic Support groups illustrate how consumption of food and beverages has reduced by perhaps 25%. These drugs are soon to be available in a pill form that is both cheaper and more effective.
The New York Times recently reported that restaurants have trimmed their portions (https://www.nytimes.com/2024/09/24/dining/restaurant-portions.html). However, the drop in alcohol consumption means they can't lower their prices. Restaurants thrive on liquor sales."
Read the full post here.
13:47 UTC
[The FIAT Thread] The Joint Committee on FIAT Discussion Session. - 30 September 2024
Here ye, here ye, the Joint Committee on Finance, Infrastructure, Academia, and Technology is now in session. In this session of the FIAT committee, all are welcome to come and discuss economics and related topics. No RIs are needed to post: the fiat thread is for both senators and regular ol’ house reps. The subreddit parliamentarians, however, will still be moderating the discussion to ensure nobody gets too out of order and retain the right to occasionally mark certain comment chains as being for senators only.
23:00 UTC
ABC Journalist knows more than the RBA
The attached article purports to say that Australia's Central Bank rigidly adheres to the Phillips Curve in deciding monetary policy.
Nowhere does he acknowledge that the RBA's concern is that inflation is too high, and nowhere does he recognise that economists have known for decades that the Phillips Curve is a short run phenomenon only.
I'm a bit hazy on how seriously economists take the concept of the NAIRU, but it's not part of a cynical plot to keep unemployed labour hanging around depressing wages. It just reflects the fact that structural and frictional unemployment always exists.
04:35 UTC
Sahm rule: Read the rule before using it
When the Bureau of Labor Statistics released the June unemployment rate in July, the American Institute for Economic Research (AIER) asserted that the new data "triggers the Sahm Rule". Dr. Peter St. Onge of the Heritage Foundation tweeted about "unemployment ... triggering the Fed’s dreaded Sahm Rule that says we are already in recession".
The Sahm rule indicator was at 0.43 in June 2024, below the 0.5 threshold identified by Dr. Claudia Sahm as a recession warning. AIER and Dr. St. Onge made the mistake of using monthly data in their calculation, rather than the 3-month averages set out in the Sahm rule formula. Neither AIER nor Dr. St. Onge has corrected the record even though the St. Louis Fed publishes data for the Sahm rule indicator.
It is true that the Sahm rule did trigger the following month. But, that is no excuse for being one month early by not checking the formula.
https://economystupid.substack.com/p/sahm-rule-says-us-economy-not-in
19:25 UTC
[The FIAT Thread] The Joint Committee on FIAT Discussion Session. - 19 September 2024
Here ye, here ye, the Joint Committee on Finance, Infrastructure, Academia, and Technology is now in session. In this session of the FIAT committee, all are welcome to come and discuss economics and related topics. No RIs are needed to post: the fiat thread is for both senators and regular ol’ house reps. The subreddit parliamentarians, however, will still be moderating the discussion to ensure nobody gets too out of order and retain the right to occasionally mark certain comment chains as being for senators only.
10:00 UTC
Deranged YIMBYs Threatening Your Sewerage Capacity with Ineffectual Policy Proposals? It's More Likely Than You Think. With Tonight's Special Guest: Jane Jacobs is a Fraud and New York is an Anti-Trust Policy Failure.
A recent article in HBR purports to make the case against the YIMBY movement. It will be worth our time to read through this argument, as we shall see that we have apparently reached the end of history whereas housing policy is concerned: YIMBYism, it would seem, is the only legitimate position remaining that can sustain itself throughout the course of a housing policy discussion, and even its putative critics here fast reveal themselves to be crypto-YIMBYs.
Let us begin our walking tour of their piece. The authors start by offering this, in my opinion, quite fair characterization of the YIMBY / pro-market stance:
The housing market can be repaired with the simple fix of liberalizing zoning rules and other public regulations allegedly strangling the supply of new homes, which they say will lead to an explosion in housing construction. Once the government gets out of the way, private actors will fix the problem themselves.
Fair play deserves fair play, so I will offer you a condensed (but I hope fair) characterization of their stance:
There’s another view, however, in which one underappreciated cause of runaway housing costs is the market power of developers and landlords — and more recently, software that allows them to leverage this power in unfair ways. [...] These [anti-trust issues related to the RealPage app] show the limits of a “trust the market” approach to housing policy. Research from around the world shows that more permissive zoning rules do not, by themselves, lead to a major increase in housing supply, let alone more affordable housing. The truth is that the market itself needs to be fixed. Specifically, any plan to overhaul the housing market needs to, first, confront the power of landlords to raise rents. Second, it requires rethinking public governance of housing markets beyond simplistic prescriptions to just free the housing market from government regulation, assuming lower rents will follow. And third, to that end, we need more — not less — muscular government involvement in housing, through price regulation, more robust planning, and even direct public provision.
The antitrust element of this argument is, of course, of no real interest to me or, I imagine, any reader here. True, the authors dedicated quite a bit of space to it -- there are 7 paragraphs that I am going to skip over that talk about it and the RealPage app prosecution. But I judge it as being of little interest since, at best, the anti-trust question is more or less orthogonal to the YIMBY policy agenda. There's nothing incompatible between the view "unleash the market: legalize housing" and "unleash the DoJ antitrust division: make the market competitive". If anything, one might imagine that busting whatever landlord cartels and collusion apps exist would be quite complementary to a neoliberal YIMBY agenda. If I'm going to have the market fix the problem, I would want to invest in making sure the market is competitive!
I imagine the authors of the article wouldn't really disagree with the above point. You might think they would. But actually, they sort of acknowledge my point above at the end of their 7 paragraph stretch on antitrust policy, and more or less dismiss antitrust as a solution to the housing cost problem themselves. In particular, they characterize it as an insufficient 'Econ 101' solution to the problem of high housing costs:
[...] At a minimum, antitrust enforcement and a ban on algorithmic rent-setting is required. But enabling more competition along the lines of what’s described in Econ 101 textbooks isn’t enough, because there’s little evidence that private developers alone will — or can — provide enough housing to fix this crisis.
Ah, well. I suppose their view is that antitrust activities are a noble enough diversion, but at the end of the day, something of a waste of time, given that markets don't really work anyway. How disappointing for us! It's also a bit odd to bring it up, then, since (a) they reckon it doesn't really move the needle, and (b) they note that it isn't really a part of the YIMBY agenda as they see it. But I suppose when you work for Matt Stoller's old haunt, honor obliges you to at least make a pitch or two for an antitrust being the solution to whatever problem happens to be at hand.
Anyway, with the perhaps obligatory antitrust shout out out of the way, they proceed to the meat of their argument against YIMBY-ism. Here it is, in condensed form:
The most extreme version of “trust the market” housing policy is the common refrain — popularly associated with the “Yes in My Backyard” (or YIMBY) cause — that zoning rules are a primary, if not the primary, cause of the present housing crisis. [...] This cause is commonly captured in the slogan “legalize housing.” The idea is to get out of the market’s way and let the drive for profit solve the problem.
Profit considerations, however, mean that more liberal zoning rules are at most necessary, but not sufficient, to increase the supply of housing. Just because private developers can build housing does not mean they will. Liberalization of zoning regulations appears to increase the supply of housing, but the effect is rather modest. [...]
The problem, generally, is that building housing is just one way to profit from a piece of land, and zoning reform tends to increase land values. [...] In many places, expectations of inadequate profits — not zoning — appear to be the primary constraint on further housing construction by the private sector, as profit-motivated corporations are reluctant to build. Developers sometimes acquire and “bank” tracts of land for the future and develop them when expected profits are higher. Alternatively, they may build luxury units and focus their efforts on the affluent. [...]
Upzoning alone is also a contributor to displacement. [...] With the lure of higher land prices, property owners evicted current tenants and sold their plots to developers, pocketing a tidy windfall. In these cases, upzoning did not produce affordable housing or even a net addition of housing. Instead, it resulted in the replacement of older residential buildings and small businesses with higher-end apartments, condominiums, restaurants, and retail. Families and business proprietors who had lived and worked in one place for decades were forced to uproot and resettle, [...]
So, in brief, their view is that:
- Zoning reform is likely to be anemic in its impact - housing supply just doesn't respond much to zoning.
- Zoning reform is anemic because building housing just isn't that profitable. You can reform zoning, but at the end of the day, developers will mostly prefer to speculatively buy land and sit on it, rather than go to the trouble of actually building something on it -- some maybe rare cases where they can put up an ultra-luxe building aside.
- The one thing zoning changes reliably achieve is gentrification: rezone an area and you should expect housing supply to stay the same or fall, while everything becomes more expensive.
I suppose I could take some time to really engage with this set of arguments. For example, (3) seems to be mistaking the partial equilibrium effect of upzoning for its general equilibrium effect (at best - the part about housing supply falling as the 5-over-1s invade strikes me as puzzling). And the business about housing just being too unprofitable to bother with also struck me as a bit odd, though I am sure if I wanted to hear a clearer and more detailed recitation of the argument, I'm sure it exists somewhere in the minutes of every city council meeting, probably in the part of the agenda reserved for subsidy-begging by developers.
Really, though, I am not sure much discussion of the above is warranted, as when we read the authors' preferred solutions to the housing problem, I think we will learn that the authors themselves are not much impressed by their own arguments.
So, let's look at their proposals. We begin with, oddly enough, with the return of antitrust schemes:
First, the federal government, states, and private plaintiffs’ bar must vigorously enforce the antitrust laws against real estate entities. [...]
I mean, I'm all for it - but I thought that competition wasn't enough? That in a competitive market, private developers wouldn't - or couldn't - provide enough housing to fix the crisis? I sure hope this isn't the entire story!
But collusion is hardly the entire story. Antitrust and other laws against unfair business conduct should be used to stop myriad restrictive practices in housing and land markets. [...] Private home and community developers have long imposed restrictive covenants, which bar purchasers and all future owners from certain uses. Millions of homes are subject to these restrictions, [...] including ones that prevent the construction of multifamily housing, establish minimum lot sizes, and even restrict non-traditional households from living in a neighborhood. Often enforced by private homeowners’ associations, these covenants function as a form of private zoning, but enacted without public input.
Huzzah, using antitrust to stop collusion wasn't the entire story! It seems that a more complete vision of what antitrust policy can do is that we can use it to repair housing markets by implementing the simple fix of liberalizing zoning rules restrictive covenants, which will lead to an explosion of housing construction. The logic being that once the government your HOA gets out of the way, private actors will fix the problem for themselves.
Interesting. Well, what else have you got for me?
State, regional, and local governments must engage in public planning. [...] Uncoordinated housing construction can lead to traffic congestion and overburdened bus, rail, and school systems and even inadequate water supply and sewerage capacity. Further, planning can mitigate the harmful effects of upzoning done in isolation. It can promote economically and racially diverse communities and prevent mass displacement following upzoning.
When upzoning land, some cities try to capture a portion of the increased value through public benefits agreements. For example, [...] in Brooklyn, [...] Developers got their rezoning, in exchange for a broad range of public benefits, including a new school and affordable housing.
[...] A necessary part of planning is zoning reforms that permit the construction of more housing, without also creating easy profit opportunities for speculators at the expense of established communities.
So, to take stock, we're arguing that the YIMBY psychos are set to unleash a tsunami of new housing upon our great nation's unsuspecting neighborhoods that will be so large in magnitude that -- without the government pumping the brakes on things -- the new residents in your town will literally clog the sewers and prevent you from taking a shit in your own home. The good news, though, is that government planners can slow things down and make sure things are wisely planned out in a way that keeps you from having to switch to septic. Moreover, since the YIMBY development plan will be insanely profitable for developers, planners can shake them down for concessions -- the government can name its price, and get all the schools and whatever else it wants built, gratis, just by modestly imposing on developers' immense profit margins.
Now, perhaps you forgot, but this piece began by arguing that zoning reform is a busted flush, unlikely to yield even modest increases in housing supply, and that this is due in part to the fact that housing development projects are pretty low return and not really worth engaging in for developers even when legal.
I'm not really sure how we got from point A to point B here. Did the antitrust cartel busting stuff increase developers' profit margins a whole bunch? Am I to believe that the net effect of the restrictive covenants is greater than that of zoning more broadly? In fairness, I elided over the fact that the authors had a stray paragraph in the antitrust section talking about how rent controls are great -- maybe the rent controls are what would make development projects suddenly very profitable to engage in? How did we get from zoning reform as paper tiger to zoning reform as potent force menacing our sewers?
I suppose at this point I should step back and note that, in fairness, they have a few not-very-NIMBY things in this article. As mentioned, there's that paragraph about rent control. And they tack on 3 paragraphs at the end of the article about how the government should directly build more housing (good luck without YIMBY reforms). But, come on, the heart of this piece isn't there. All the meat, all the energy -- it's all about the odd blend of why pro-market initiatives (a) won't really work, and (b) will work so well they will create even larger problems that the government must be prepared to address.
So, like I said, I'm puzzled. I thought I was going to read about how the YIMBYs are chumps that took Greg Mankiw's textbook a little too seriously, and instead got some proposals for antitrust policies that complement the YIMBY agenda and received a stern warning that the YIMBY plan will produce housing at a pace that is too-fast-too-furious for America to handle.
That being the case -- why did I have to read this? Why did they want to write this?
I suppose a person might be led to speculate that this article is strictly an expression of affective discontent that YIMBYs, who code as neoliberal, seem to have snatched the baton of history on this issue, when it might have been more pleasing if the baton carriers instead coded as 'progressive'. From this speculative lens, one might reckon that the authors don't particularly disagree with the direction the YIMBYs are carrying the baton, some anxiety about sewerage capacity aside. Instead, they just wish that the YIMBYs were cooler -- which is to say, more like the authors in language and outlook. Strip the YIMBYs of their black socks and cargo shorts, give them the right indie band t-shirt, and they might be acceptable!
Of course, I would not endorse such speculation, because it would suggest that the Harvard Business Review was fooled into publishing a somewhat frivolous article that struggles with internal coherence. And how could I suggest such a thing of an august outlet with a history of publishing genuine bangers?
P.S. - I have skipped over a fun section buried in their case for government planning. It wasn't too relevant to the overall point, but let's consider it here on the B-side of this RI:
Federal planning is important as well. A common YIMBY refrain is that the current economic geography of the United States, and resulting housing crisis on the coasts, is primarily the product of the economics of agglomeration, in which the productivity of any given firm is a function of the number of other businesses also operating in the same place. The coastal cities where housing costs have exploded, the argument goes, are simply the most productive cities, which naturally attract the lion’s share of labor and capital. In this view, the role of policy is helping people “move to opportunity,” by building more housing for them in wealthy cities.
The agglomeration view, however, neglects other factors that have concentrated wealth in a few cities, such as monopoly power concentrating wealth on the coasts where the largest firms are located, and the powerful role federal policy has played in creating and entrenching the regional economies of places like Silicon Valley in the first place. (In the case of Silicon Valley, defense contracts and publicly-funded university research have played a key role.)
Really? The theory of the case is that agglomeration is fake, it's largely just about where the monopolists are located? And I suppose we are to think that antitrust policy is going to, what, smooth out the distribution of population across the United States? I mean, come on.
Urban economics has churned up just piles and piles of evidence for agglomeration. Here's one of my favorites -- they even pin down on a map the bars and other places where the agglomeration externalities are getting generated in San Francisco. And then there's the matter of leisure agglomeration. I might find a small town here or there that can offer me the opportunity to regularly attend ballets, or to eat well-prepared Szechuan food, or to send my kids to a school with an actually diverse student population, or to go to an electronic music show at 1am, or to go to a Korean spa, or to have a tertiary hospital nearby, or to go to a nice history museum, or to have a specialized job in the same general vicinity of many of my friends. At the end of the day, however, you're only going to get 'all of the above' in a city - and that helps drive demand for them. Somehow, I don't think antitrust policy will move the needle on any of this.
Now, in fairness, the authors do also gesture to the fact that they don't actually disagree with the agglomeration explanation for the desirability of cities. For example, they complain that UC Berkeley and other universities helped build up San Francisco. Well, university knowledge spillovers are a very classic agglomeration type thing - I doubt they would strike Jane Jacobs as out of place, anyway. And they probably work against monopoly power, since new competitors can always spring up in the form of university students with startups. So the authors seem to think the agglomeration view is a mere YIMBY refrain, blindered to the fact that monopoly power is what drives urbanization. But then just as quickly they cite factors driving city formation that are really just about the agglomeration story again.
I suppose this B-side RI of mine is a bit unfair - after all, I am making a lot of hay out of what is really a pretty brief chunk of text in the authors' article. One has to imagine that if they had more time to discuss the issue, they would have offered a more elaborate version of their argument. Perhaps they would ultimately have persuaded us that agglomeration is tosh, that it's all about monopoly power being concentrated in coastal cities, and that if we unleashed antitrust policy to work its magic, it would enabled untold amounts of productive spillovers between small firms in cities that would create a policy crisis (requiring government management) in the form of the American heartland depopulating to move to coastal cities.
Oh, to be fair to them, I should probably show you the conclusion they offered to this little agglomeration discussion:
Seen in this light, reforming housing policy to cram 10 million more people into San Francisco and New York in blind obedience to the laws of agglomeration is the wrong tool for the job, when directing industrial policy to create jobs and generate opportunities where people currently live is also on the table.
Ha! Well, good luck, babe!
03:25 UTC
[The FIAT Thread] The Joint Committee on FIAT Discussion Session. - 07 September 2024
Here ye, here ye, the Joint Committee on Finance, Infrastructure, Academia, and Technology is now in session. In this session of the FIAT committee, all are welcome to come and discuss economics and related topics. No RIs are needed to post: the fiat thread is for both senators and regular ol’ house reps. The subreddit parliamentarians, however, will still be moderating the discussion to ensure nobody gets too out of order and retain the right to occasionally mark certain comment chains as being for senators only.
21:00 UTC
Correcting the record on the determinants of home prices
Every year or so, someone writes the same article on the determinants of home prices, trying to argue that prices are more demand driven than supply driven (this time from Aziz Sunderji on substack). The argument goes like this:
- Plot home prices or rent on the Y-axis and incomes on the X-axis
- Observe that prices and incomes are extremely positively correlated
- Note that the handful of cities off the line of fit can mostly be explained by very obvious amenities (hawaii and los angeles have great weather; minnesota has bad weather; new york is new york)
- Don't cite rosen-roback
- Conclude that prices and changes in prices are mostly demand driven, not supply driven, and that we should focus more on incomes than on changing zoning regulations. (In this case, pretty explicitly by saying: "But loosening regulation to help unlock supply will only help on the margins. It constitutes rearranging the deck chairs while the Titanic is sinking." )
Because every person that writes this article can't do exactly the same thing as all the other people who do it, we usually also get one or two bonus points. In a Jacobin article that tried this same thing, the point was that an index of supply regulations correlated much more weakly with prices than incomes did. This time, the author also looked at changes and home prices and changes in incomes and found a similarly strong correlation.
Everyone, rosen, roback, and me included, agree that incomes (demand writ large) should be key determinants of prices, so what's the issue with plotting incomes against prices and using that to think about whether supply matters more or less than demand?
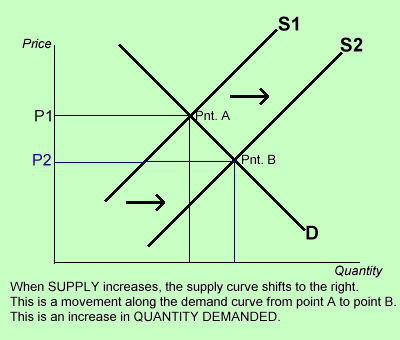
Let's take the author's changes in incomes and changes in prices, since this will make the example easier to think about. Now, go back to your econ 101 demand and supply curves. If there's an outward shift in demand, this should show up in two places, prices and quantities. If supply is perfectly elastic, the shock should show up entirely in changes in quantities, and if supply is perfectly inelastic it should show up entirely in prices.
With that in mind, let's go back to the changes in incomes and changes in prices. If there's a demand shock for a city and the city is more supply constrained, we should get a stronger correlation between prices and incomes.
The simple way to get prices and incomes to positively correlate is that if the demand shock is productivity related (e.g., a tech boom in San Francisco), then incomes go up and prices go up. In the classic Rosen-Roback model, if supply is perfectly inelastic and there's a productivity shock, nobody moves and the productivity gains are fully offset by increases in land prices. Note that in this extreme case, despite this result being *because* supply is perfectly inelastic, it looks like income changes are the only thing driving price changes. If supply is more elastic, and wages decrease with population growth (or, congestion externalities prevent corner solutions where everyone goes to a single city), a productivity shock shows up in prices, incomes and population changes, with the specific ratios being governed by partly by the elasticity of housing supply.
The slightly more nuanced version is that if there's a demand shock, and supply is constrained, prices increase, low income households are priced out, which forces median income upwards due to sorting, and induces a positive correlation between incomes and prices with the slope of the correlation being again moderated by the elasticity of supply. (San Francisco would have lower income households if it had built more housing, which would push down the correlation between demand and incomes).
From this, we can see that the steepness of the relationship between incomes and prices does not imply that prices are income (demand) determined, not supply determined. It's the classic alfred marshall problem of which blade of the scissors sliced the piece of paper.
So, do we see this play out in the data? First, let's replicate what the author did by plotting changes in income against changes in home values. They correlate very strongly. Next, let's plot changes in population against changes in home values.
Here we see my point: in places where supply is more elastic (like Houston and Phoenix) demand shocks show up in population growth less than price growth. Where supply is more inelastic (California counties plus New York), demand shocks show up in prices more than population growth. For places where supply is reasonably elastic and demand was strong, like Austin and Seattle, demand shows up in prices and quantities. Obviously, this isn't perfect as we have no conception of the magnitude of a demand shock, but the point should be clear: Don't reason from a price change in (spatial) general equilibrium.
Edit:
If I was going to be precise, it's less that you wouldn't see a steep correlation between income and prices absent binding supply constraints and more that you would see much less variation in income across space. A large part of the Bay Area's income "boom" was that there was an exodus of lower income households; with more housing supply there would have been lower rents, less migratory pressure, and lower incomes through sorting.
21:57 UTC
[The FIAT Thread] The Joint Committee on FIAT Discussion Session. - 27 August 2024
Here ye, here ye, the Joint Committee on Finance, Infrastructure, Academia, and Technology is now in session. In this session of the FIAT committee, all are welcome to come and discuss economics and related topics. No RIs are needed to post: the fiat thread is for both senators and regular ol’ house reps. The subreddit parliamentarians, however, will still be moderating the discussion to ensure nobody gets too out of order and retain the right to occasionally mark certain comment chains as being for senators only.
08:00 UTC
[The FIAT Thread] The Joint Committee on FIAT Discussion Session. - 15 August 2024
Here ye, here ye, the Joint Committee on Finance, Infrastructure, Academia, and Technology is now in session. In this session of the FIAT committee, all are welcome to come and discuss economics and related topics. No RIs are needed to post: the fiat thread is for both senators and regular ol’ house reps. The subreddit parliamentarians, however, will still be moderating the discussion to ensure nobody gets too out of order and retain the right to occasionally mark certain comment chains as being for senators only.
19:00 UTC
Utsa Patnaik on comparative advantage
The badeconomics is here.
The author criticizes the riciardian theory of comparative advantage:
A fallacy in a theory can arise either because the premise
is incorrect,or because the argument is incorrect. In the case of the
comparative advantage theory applied to Northern trade with warmer
lands, the premise itself is incorrect. The premise is that in the pre-
trade situation (assuming the standard two-country two-commodity
model) both countries can produce both goods. Given this premise,
then it can be shown that both the countries gain by specializing in
that good which it can produce at relatively lower cost compared to
the other country, and trading that good for the other good: for
comparedto the pre-trade situation, for a given level of consumption
of one good a higher level of consumptionof the other good results
in each country. This mutual benefit arising from comparative
advantage, is adduced as both the reason for and the actual outcome
of specialization and trade.
This is a passable explanation of the basic two countries-two goods model of comparative advantage, albeit specialization is not an inevitable outcome as it relies on the ability of both countries to produce enough the satisfy each other's demands (if this is not the case world prices will be equal to the autarky prices of the country that is able to supply more labor, which will produce both goods, see chapter 1 of Feenstra's Advaned International Trade: Theory and evidence).
Patnaik argues that the northern countries cannot produce some tropical crops at all and therefore the theory of comparative advantage does not apply:
If absolute cost is not definable, then ipso facto
relative cost is not definable. The premise of the theory does not
hold, namely that both countries can produceboth goods, hence the
conclusion does not hold, that specialization and trade is necessarily
mutually beneficial.
She gives a few examples. like that of England which cannot produce grapes.
Leaving aside wether these goods are actually impossible to produce or merely very difficult and costly, the conclusion is incorrect.
The fact that one country cannot produce one of the goods while other can means that the other has an absolute advantage in the production of said good.
Indeed it is the most obvious case of absolute advantage, as the cost of production of the good is in a sense infinite.
In this case, optimal specialization implies that England would produce the good that... they can actually produce and trade it for the good that it cannot produce domestically.
Edit: accidentally misgendered the author
16:57 UTC
Why Barbados does not exploit the United States or, Jason Hickel et al. on unequal exchange
A few recent papers have revived the idea of unequal exchange.
Two papers have caught my attention. They have a few different authors, however I have elected to single out Jason Hickel as the most prominent, whenever you read Hickel think the authors of the paper.
The main thesis of the two papers is that the imperialist/core/global north countries are able to consume more than they would under conditions of fair (non-exploitative) trade because they use their power to impose unfair terms on the colonies/periphery/global south.
Hickel is explicit that this northern plunder is not relative to autarky but to a condition of fair trade, thus he does not imply that southern countries would benefit from isolating themselves.
Hickel also presents this unequal exchange as an alternative explanation for international per-capita income differences.
These core countries exploit periphery countries by paying them less for their work than they would in the north.
From the 2021 paper
This net appropriation occurs because prices are systematically lower in the South than in theNorth. For instance, wages paid to workers in the South are on average one-fifth the level of Northernwages (Cope 2019, p. 80). This means that for every unit of embodied labour and resources the Southimports from the North, they have to export many more units to pay for it.
However this exploitation does not come from lower productivity in periphery countries but from imperial power, Hickel himself argues against productivity explanations (very badly as you shall soon see) because it’s seen as a competing explanation for lower wages in the periphery.
This exploitation is not therefore something that operates by sabotage of periphery countries productive capabilities.
It’s also not about some normative claim that equal effort ought to imply equal pay, since the same worker with different instruments can have a very different productivity (think digging with a shovel vs an excavator).
The problem with this thesis is that there is no explanation as to how this imperial power is exercised and why it manifests in such a way that it can be measured with the methods he proposes. As we will see, even accepting Hickel’s framing, it is impossible to take his calculations at face value.
This is most evident in the way countries are grouped across the Core/Periphery split, which does not seem to be explained by actual historical imperialism, since Switzerland has never been an imperialist country, and Russia definitely was.
It does not seem to be related to relative income per capita in the past, since South Korea is apparently a Core country, or previous/current poltical-economic alliances, since in the 2024 paper the Czech republic is classified as a global north country, while Poland is part of the global south.
When exactly did the Czech republic start exploiting its neighbors? Was it always doing so? Was 1960s South Korea part of the imperial core? To the extent that Hickel is making an argument about the monopoly power of rich countries, and depending on the answer, we must wonder why some countries were allowed to join the exploiters or why the leaders of such poor countries were in on it from the beginning.
This might seem like pedantry, but I don’t think Hickel should be allowed to make such strong claims about exploitation, essentialy arguing for some tacit or explicit conspiracy by northern countries, without even an attempt to explain how this system is implemented and sustained or why some countries are in on it while others aren’t.
The countries included in each group have an effect on the result and the lack of a theory that explains why some countries are part of the imperial core and which aren’t means that the results are completely unreliable and raise more questions than they answer.
Do political and business leaders of imperialist countries meet in smoke-filled rooms to conspire in order to keep prices low? Or are they somehow led to implement the same policies by some external force?
Hickel does attempt to give some examples of behaviors which keep southern worker wages low, but these seem to be either unrelated or actively work against his main point:
In the contemporary era, subsidised grain exports from the North, and land grabs by multinational companies, continue to undermine subsistenceconomies, placing downward pressure on wages
But subsidized grain export lower the prices of northern goods which is the exact opposite of the supposed mechanism behind the exploitation claim!!!.
Structural adjustment programs are also a boogeyman that Hickel is fond of, but it is unclear how they relate to his mechanism behind exploitation (Hickel seems to explicitly reject, at least in part, traditional arguments for protectionism in developing countries such as the Prebisch-Singer thesis).
Hickel does give a correct argument for international wage differences, but it does not lend credence to his conclusions about overconsumption in the north relying on southern exploitation:
Low wages are ultimately maintained through militarised borders,which preclude easy migration from South to North, and thus prevent international wage convergence.
It is true that limits to immigration stops southern workers from accessing labour markets which would reward them with a higher wage, under threat of force. In this sense they are exploited.
But the conclusion that with free immigration wages would equalize (or that the difference would diminish) is unwarranted, because the cause of low wages in southern countries isn’t an oversupply of workers but low productivity. It’s therefore perfectly possible for wages in southern countries to remain at the same level while newly arrived immigrants may very well be as productive as the native. The most obvious counter-argument to Hickel's conclusion is that significant wage difference persists even within areas that allow for free internal immigration like the US.
The most good faith interpretation of Hickel’s model of the world is one in which capital rich countries exploit their monopolistic power over capital intensive goods to artificially depress periphery countries terms of trade. This can be explained by the well-studied concept of optimal tariff theory. In international economics this theory explains that countries can exploit tariffs to change the terms of trade in their favor. Not every country can do this however, since generally they need some level of market power to pull this off.
The most obvious examples of such an exercise of market power would OPEC countries exploiting their monopolistic positions on the oil market or the EU exploiting its monopsonistic power in gas market against Russia.
I’m unaware of anything remotely similar concerning north-south trade. Most tariffs and quotas set in developed countries seem to be motivated more by income redistribution concerns than exploiting other countries, but I'm open to suggestions.
Onto the calculations in the first paper:
Köhler measures value transfer through unequal exchange by starting with the exchange rate
disparities between Northern countries and Southern countries. For instance, Köhler notes that
India’s GDP per capita in 1995 was US$1,400 in PPP terms (i.e. measured at the US price level),
but only US$340 in MER. Dividing PPP by MER yields what Köhler calls the ‘Exchange Rate Deviation
Index’, or ERDI. For India in 1995, ERDI was 4.12. Put differently, prices in the US were 4.12 times
higher than in India. For Northern countries, by contrast, ERDI is generally very close to 1. Köhler pro-
poses that we can use ERDI to measure value transfer. His formula is as follows:
T = d∗X –X
Where:
A couple recent papers have revived the idea of unequal exchange. These two papers have a few different authors, however I have elected to single out jason Hickel as the most prominent author, whenever you read Hickel think the authors of the paper.
T = value transferred through unequal exchange
X = exports from periphery to core
d = the ratio of the peripheral country’s ERDI to the core country’s ERDI
TL;DR Exploitation is when a country with low prices sells to a country with high prices. This is an unwarranted conclusion.
A country's prices are influenced by many different factors like transportation costs, climate, tax policy...
There is zero basis to assume that such price differences are entirely due to exploitation.
It also has goofy implications, such as Barbados and Iceland exploiting the United states, which seems incompatible with any explanation abount monopoly power in international trade. Link here
Hickel could respond to the above by arguing that only ERDIs between Imperialist and periphery countries matter, but then he would have to admit that ERDIs are not just caused by imperial power and therefore his calculations, which assume the opposite, cannot be trusted.
The alternative explanation for rich countries relative price level being higher is the Balassa-Samuelson effect, which is explained surprisingly well in this wikipedia article.
And this effect has actual evidence behind its existence, as well as following from a few basic assumptions about the relationship between wages in the tradeable and non-tradebale sectors. Both things that Hickel’s imperial exploitation model lacks.
The Balassa-Samuelson effect is by no means the only determinant of price levels, but it is an important one.
One might argue that the higher wages of workers in the North reflect their greater pro-ductivity. Yet this assumption is belied by a 1971 study of export processing zones in Mexico, which found that Mexican metal workers, electronics workers and seamstresses produced 10%-40% more output in an hour than their US counterparts (Baerresen 1971, p. 33).
Besides the obviously cherrypicked study, the conclusion that wage differences are unexpected in the absence of exploitation is incorrect. That the same industry in different countries pays different wages is unsurprising, because wages aren't set based on industry, but on the wider labor market.
Hickel seems to believe that if the same factory is operated by clones in two different countries any wage difference must be exploitation because we would expect their wages to be equal.
This is wrong, wages are set in the labor market and a single sector of the economy has relatively little influence on labor demand.
It's possible that the sector is the only high productivity industry in the poor country and thus there is no expectation for wages in the same sector in different countries to be equal. This could be the case if the poor country was still relying on low-productivity agriculture, which is the case for many countries in Africa.
His new 2024 paper makes the same mistake from a different perspective.
This study demonstrates that large North-South wage inequalities and unequal exchangeoccur even when accounting for sectors and skill levelsThe argument is that the net export of embodied labor from global south countries is a net loss of labor hours, this time Hickel attempts to control for different skill-levels and sectors.
I'm not going to comment on sectors, but his attempt to control for human capital is woefully inadequate. Hickel separates the skill levels into three buckets and that’s it, which doesn’t include important measures of human capital such as health
But there is a much more fundamental problem, which Hickel himself admits.
None of his calculations consider the effects of physical capital:
Physical capital per worker may better help us understand produc;vity differences, butthis data is only available at the country level (i.e. for total producton), when what mattersfor our purposes is the specific sectors and industries involved in producing goods that aretraded between North and South
This is a pretty glaring problem because it's not surprising that digging a ditch would require more labour hours if done by hand than with an excavator.
It is not legitimate to ignore such an obvious factor, but Hickel does and then repeats the misunderstanding above i.e. some industries are as productive and therefore the wages in the different countries ought to be equal.
He has a couple new arguments against the productivity objection in the supplemental material, none of which are good.
In the main text we noted that in cases where physical productvity differences do
exist, this is often because it is more profitable for capital to use cheaper, more labour-
intensive methods than to invest in modern equipment – especially in cases where state
investment in technological development has been curtailed by structural adjustment
programmes, or where patents prevent affordable access to necessary technologies –
precisely because Southern wages are maintained at artificially low levels.
But this doesn't make sense because using more productive methods would surely be more convenient for the imperialist countries? They would extract more value as the difference between the fair price, based on productivity, and the price that imperialist countries supposedly impose on them. Why aren't imperialist companies producing with the most productive method available? Is it perhaps that some factors, like extractive governements, prevents them from making the necessary investments?
Hickel also argues that physical capital differences cannot be the whole story because:
Even if it was, insights regarding comparable products and processes would not be generalizable to the totality of North-South trade,because – as described in the main text (and as Amin, Emmanuel and others have pointed out) – many of the South’s exports have no counterpart in Northern production.
Hickel in general does not like using metrics that rely on prices, such as value-added, to measure productivity differences. But even without using prices, his conclusion that productivity cannot be used to explain income differences because north and south produce different goods is flawed.
It is true that Global south countries are specialized in different sectors than their richer counterparts, but Hickel is wrong in implying that this means that the differences in wages cannot be attributed to productivity. Even disregarding prices as a measure of value, comparative advantage implies that countries who are less productive relative another would specialize in producing different goods.
Global south countries may very well have absolute advantages and Hickel’s repulsion to using prices may invalidate any comparison, but many industries in the global south are based on comparative advantage, and in that case it is possible to rank workers based on productivity, since workers in the poor country would be less productive in both southern and northern industries.
Indeed Hickel doesn’t explain why capitalists are not re-creating these northern industries in the poor countries in order to take advantage of the wage difference, he seems to take the fact that countries are specialized in different industries as a given.
Apparently there is a paper in the pipeline that deals with the question of productivity: Sullivan, D. ‘Unequal Exchange and the question of productivity’
I await its publication with trepidation.
17:08 UTC
[The FIAT Thread] The Joint Committee on FIAT Discussion Session. - 04 August 2024
Here ye, here ye, the Joint Committee on Finance, Infrastructure, Academia, and Technology is now in session. In this session of the FIAT committee, all are welcome to come and discuss economics and related topics. No RIs are needed to post: the fiat thread is for both senators and regular ol’ house reps. The subreddit parliamentarians, however, will still be moderating the discussion to ensure nobody gets too out of order and retain the right to occasionally mark certain comment chains as being for senators only.
06:00 UTC
Alternative microeconomics formulations
I want to know if there are alternative foundations for microeconomic theory that are:
Not, based on the ideas of Austrian Economics , or any libertarian bent, or are just minimal extensions or modifications of such
Mathematical and rigorous
That can predict market failures like monopolies even in the absence of government regulation
That try to serve as a foundation for macroeconomic theories?
That do not incorporate the idea of "revealed preferences" and hence predict the inelasticity of goods like health care?
That are empirical(ie try to develop a foundational theory that gets adjusted by empirical data)
And if there are, how well-developed are they?
16:25 UTC
[The FIAT Thread] The Joint Committee on FIAT Discussion Session. - 23 July 2024
Here ye, here ye, the Joint Committee on Finance, Infrastructure, Academia, and Technology is now in session. In this session of the FIAT committee, all are welcome to come and discuss economics and related topics. No RIs are needed to post: the fiat thread is for both senators and regular ol’ house reps. The subreddit parliamentarians, however, will still be moderating the discussion to ensure nobody gets too out of order and retain the right to occasionally mark certain comment chains as being for senators only.
17:00 UTC